
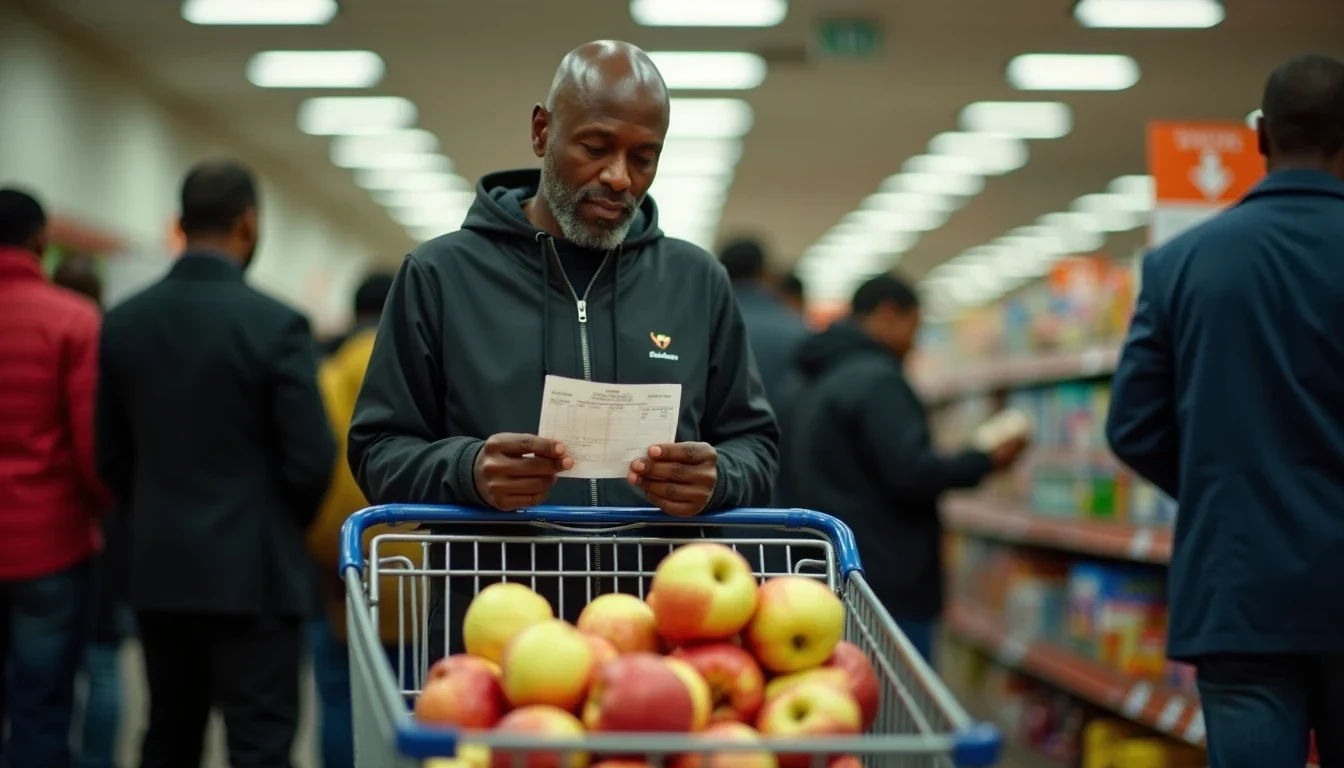
The trolley comes back lighter every month, but the receipt stays the same length. Stats SA has food and non-alcoholic beverages inflation sitting at 1.6% for June 2026, a figure that sounds almost generous until you stand in the Checkers queue watching the total climb past what you budgeted three months ago. Someone in that queue is buying chicken pieces and full-cream milk for a family of four. Someone else is loading up on apples and maize meal, quietly benefiting from prices that actually dropped. Same statistic, two completely different months.
The Average That Lies
Headline inflation is a composite sketch, not a portrait. Cereal products are in deflation territory. Fruit sits roughly 10% below where it was a year ago. Those are real savings, but they land unevenly. A household built around pap, rice, and whatever citrus is going cheap will feel that 1.6% as genuine relief. Meat tells a different story, up about 5.1% year-on-year. Dairy follows its own stubborn trajectory. The pensioner buying smaller portions of mince and a half-dozen eggs feels it. The family roasting a weekly chicken definitely feels it. The young professional grabbing a single steak for a Tuesday dinner feels it most acutely because solo shoppers pay per-unit premiums that bulk buyers avoid.
Stats SA’s methodology is sound for tracking macro trends. It was never designed to mirror your specific till slip. The agency collects thousands of prices across categories, weights them by national consumption patterns, and produces a single figure that no single household actually experiences. This is not a flaw in the data; it is a limitation every consumer needs to understand before using that 1.6% to plan a monthly budget.
Three Trolleys, Three Realities
Consider what actually goes into three typical monthly shops, priced at shelf rates without loyalty discounts applied.
A pensioner couple, two people watching portions and sodium, might pull: 10kg maize meal, 2kg rice, a daily loaf of brown bread, 1kg oats, 1kg chicken pieces, 500g mince, a dozen eggs, two tins of pilchards, 4L milk, 1kg plain yogurt, 250g butter, plus potatoes, onions, carrots, seasonal apples, lettuce, tea, coffee, sugar, basic cleaning supplies, and two tins of baked beans. The staples in this basket are where the deflation lives. The protein and dairy are where the pain concentrates. The overall number might track near that 1.6%, but the psychological weight falls on the items that feel essential rather than substitutable.
A family with schoolchildren, two adults and two kids, scales everything up and adds complexity: 25kg maize meal, 5kg rice, 2kg pasta, two loaves of white bread daily, oats, flour, 4kg of chicken in whole birds or portions, 2kg mince, a kilogram of sausages, two dozen eggs, fish fillets, 12L of milk, cheese, yogurt, butter or margarine, plus the vegetable haul, breakfast cereal, biscuits, chips, juice, peanut butter, jam, cleaning supplies, toiletries, and whatever lunchbox fillers survive the week. This basket is heavy on the categories that rose. The 5.1% meat increase multiplies across four kilograms of chicken. The dairy volume is relentless. Any fruit savings get swallowed by the sheer tonnage of protein and calcium required to feed growing bodies.
The young professional living alone shops differently, and often less efficiently: 2kg rice, 500g pasta, a weekly loaf of brown bread, half a kilogram of oats, chicken fillets in small packs, a single steak, six eggs, two tins of tuna, 4L milk, small yogurt, a wedge of cheese, minimal butter, modest vegetables, seasonal fruit, bagged salad, instant coffee, maybe a frozen pizza or jarred pasta sauce, snacks, basic toiletries, and small-format cleaning products. The per-kilogram cost here is the highest of the three households. Convenience commands its tax. Smaller packs mean higher unit prices. The ready-meal options that save time carry margins that raw ingredients do not.
Same retailers, same month, three fundamentally different inflation experiences.
Where You Shop, What You Pay
Retail architecture shapes these outcomes in ways the headline figure cannot capture. Shoprite and Checkers, under the same group umbrella, run distinct strategies. Shoprite pushes aggressive pricing on bulk staples, targeting price-sensitive shoppers with 10kg maize meal and value-pack everything. Checkers chases a slightly more affluent customer with its Xtra Savings programme, layering member-exclusive discounts on top of already competitive base prices. Pick n Pay occupies the middle, leaning on Smart Shopper personalised vouchers and frequent promotions to keep baskets palatable. Woolworths operates at a premium across almost every category, though its Wrewards programme and targeted instant savings can soften the blow for committed members. Spar, franchised and variable, trades on convenience and location rather than uniform low pricing.
The same litre of milk, the same cut of chicken, can sit at meaningfully different price points depending on which floor tiles you are standing on. A pensioner shopping strategically across two retailers, chasing where the maize meal is cheapest and where the pilchards are on promotion, can beat the average. A time-poor professional hitting one Woolworths for everything pays for the efficiency.
The Loyalty Gap
This is where the real divergence happens. Checkers Xtra Savings prices, visible on shelf labels as two-tiered figures, routinely offer 10% to 25% off specific items for members. Pick n Pay Smart Shopper builds personalised discounts from purchase history, sending vouchers via app or SMS that reflect actual buying patterns rather than generic promotions. Woolworths Wrewards runs instant savings of 10% to 20% on selected lines, with tiered benefits for higher spenders.
The pensioner who activates every Xtra Savings offer on their weekly shop pays a different effective inflation rate than the pensioner who does not. The family loading Smart Shopper points onto meat and dairy promotions narrows their personal gap with the official statistic. The young professional who never downloads the app, who pays shelf price for convenience, absorbs the full impact of every category-specific increase.
Private label brands add another layer. Checkers Housebrand, Pick n Pay No Name, Woolworths Essentials. These are not compromises for the desperate. They are deliberate economic choices that compound across a monthly basket. A family switching national brand cornflakes to No Name, national brand peanut butter to Housebrand, is making a decision that no aggregate inflation figure can describe.
Slower Is Not Cheaper
The distinction that needs to survive this conversation is simple but politically fragile. Inflation at 1.6% means prices are still rising. They are rising more slowly than before. They are not falling. A product that cost R50 last June and R50.80 this June has not become more affordable. It has become less unaffordable, which is not the same thing at all.
Deflation, actual price decreases returning to previous levels, is rare and usually signals economic distress. What South Africa has now is disinflation, a cooling of the rate of increase. The family paying R320 for a monthly chicken allocation last year and R336 this year is not experiencing relief. They are experiencing a smaller insult than the year before, which is cold comfort when the absolute number keeps climbing.
This matters for how households plan, how wage negotiations proceed, and how social grants are calibrated. A 1.6% figure can be cited to justify restraint in all three domains. The family with schoolchildren knows that their actual food outlay has not restrained itself. The pensioner on a fixed income knows that “slower growth” is still growth they must absorb.
The Trolley’s Verdict
The official number is not wrong. It is merely insufficient. A single figure cannot hold the experience of a pensioner in Soweto, a family in Durban’s northern suburbs, and a software developer in Cape Town’s city centre. Each shops different volumes, different categories, different retailers, with different levels of engagement with the loyalty programmes that increasingly determine what groceries actually cost.
What the trolley reveals, week after week, is that inflation is not an environment. It is a transaction, specific and personal. The 1.6% is real for someone. For plenty of others, the number that matters is closer to 5%, or higher, or occasionally lower if they have built their whole month around discounted apples and cheap pap. The disrespect is not in the statistic itself. It is in using that statistic to describe a reality it was never built to capture.